Maximum Ratio Transmission for Pedestrians’ Safety at Crosswalks in An Outdoor V2X Environment at 28 GHz
Sai Radha Abhigna Maturi*, Hussain Al-Rizzo and Nijas Kunju
Department of Electrical and Computer Engineering, University of Arkansas at Little Rock, Little Rock, AR 72204, USA
E-mail: smaturi@ualr.edu; Nijas.Kunju@ansys.com; hmalrizzo@ualr.edu
*Corresponding Author
Manuscript received 09 June 2025, accepted 17 December 2025, and ready for publication 31 December 2025.
© 2025 River Publishers
DOI. No. 10.13052/2794-7254.026
Abstract
Vulnerable Road Users (VRUs) include pedestrians, bicyclists, and motorized two-wheelers operators. According to the World Health Organization’s (WHO) 2023 Global Status Report on Road Safety, pedestrians account for 23% of fatalities, or at least 31 deaths every hour. In developed countries, the number of road accidents is significantly declining, but a significant percentage of accidents involving VRUs still remains high. Vehicle-to-everything (V2X) communication is one such safety feature that fosters communication amongst numerous elements on the road for cooperative safety and, consequently, pedestrians. Communication between vehicles and pedestrians (V2P), infrastructure and vehicles (V2I), and vehicles themselves (V2V) is a part of vehicle-to-everything (V2X). Pedestrians carrying mobile devices and wearable technology can depend upon V2X communications to improve their safety and situational awareness. To transmit and receive signals efficiently, this paper compares and evaluates the performance of Linearly Polarized Antenna array (LPA) with and without Maximum Ratio Transmission (MRT) technique in the context of V2P communications. The focus is on the pedestrian’s point of view at crosswalks in outdoor V2X scenarios. In conclusion, LPA with MRT technique surpasses in signal reception at pedestrians near crosswalks in a V2X outdoor environment.
Keywords: FR2, LP, MRT, VRU.
1 Introduction
The Governors Highway Safety Association (GHSA) released preliminary data in 2023 showing 7,318 pedestrian traffic fatalities in the United States. According to the report [1], 844 pedestrian fatalities were recorded in the ten most populous U.S. cities. These statistics show that pedestrian deaths occur most frequently in urban areas. Consequently, the safety of pedestrians is an essential consideration in modern transportation systems, especially in urban areas where pedestrian-vehicle interactions are common.
V2P, which is a subset of V2X, is a general term that refers to the exchange of data between automobiles and pedestrians’ wearable technology and smartphones. Real-time alerts to avert collisions are made possible by this technology, which enables the sharing of vital information regarding the position, velocity, and direction of pedestrians and automobiles. To guarantee the prompt delivery of safety- critical signals, V2P communication uses Cellular V2X (C- V2X) or Dedicated Short-Range Communication (DSRC) platforms [2]. The DSRC band ranges from 5.85GHz to 5.925GHz [3]; these platforms leverage low latency and high dependability. Numerous studies have exhibited the efficaciousness of V2P communication in augmenting pedestrian safety [4] and [5]. Moreover, the authors in [6] emphasized the advantages of employing V2P systems to alert pedestrians to oncoming automobiles, thereby decreasing reaction times and enhancing situational awareness. Similarly, [7] remarked on how robust connectivity in different urban areas may be achieved with C- V2X-based V2P communication, which is vital for applications related to pedestrian safety.
V2X operates in two frequency ranges: FR1, which spans from 410 MHz to 7.125 GHz, and FR2, from 24.25 GHz to 52.6 GHz [8]. Specifically, the 28 GHz millimeter-wave (mmWave) band has attracted much interest due to its high data rate capability, improved stability, and low power consumption [9]. Because of its low latency, the mmWave band holds excellent potential for high-level safety applications in V2X communications, such as reducing traffic accidents. This mandate forces the antenna architecture to consider essential design concepts like simplicity, affordability, and miniaturization to guarantee that it satisfies the demands of V2X communications [10] and [11]. Because of this, Microstrip Patch Antennas (MPAs) have become more attractive because of their small size, lightweight, cost- effective production, and ease of assembly [12].
Ansys HFSS is used to produce realistic geometry with intersecting roads that resemble an Outdoor V2X environment. A single MPA is used as a receiving antenna (RX) placed on the hands of four pedestrians carrying smartphones or other devices at the crosswalk. A two-by-two transmitting antenna (TX) array is mounted on the traffic signal. The power density in W/m2 is computed over a square prediction area of length and width of five meters to see the power distribution at the pedestrians’ hand height, roughly equal to one meter. Received power at the pedestrians’ RX antenna is computed and compared with and without MRT weights placed at the TX. In summary, LPA targets pedestrians with MRT more successfully than without MRT; according to the observations, 7dB more power has been received. It should be emphasized that this conclusion is valid only for the specific scenarios and antennas used in this study and, hence, cannot be generalized to other scenarios and/or antenna arrays.
The rest of the paper is organized as follows. The scenario and the solvers utilized for the simulations are covered in detail in Section 2. The TX and RX antenna gain patterns and their reflection coefficients are provided in Section 3. Section 4 discusses the system model and the MRT weights formulation. Section 5 displays the power density maps that illustrate the power distribution around each pedestrian. This can be observed both with and without MRT cases. Section 6 shows received power comparisons. Section 7 stands as the paper’s conclusion.
2 Simulation Scenario and Solvers
2.1 Urban V2X Scenario
A four-way intersection used in this paper is depicted in Figure 1, with street length measured as 50 m and four lanes, each 15 m is the width of the road. The following elements are included to make it an appropriate, realistic urban V2X scenario: cars, pedestrians at crosswalks, buildings, trees, and other infrastructure, such as street and traffic lights. All these elements are assigned their respective material assignments, including permittivity and conductivity. The TX antenna is placed on the traffic light facing toward pedestrians 1 and 3, and pedestrians 2 and 4 are placed on the opposite side of the TX antenna. RX antennas are mounted at all four pedestrians. These antennas are assumed to be a part of the wearable gadgets of pedestrians or installed on smartphones. The entire scenario is animated in time for a second (i.e., from 0 to 1 sec) with ten intervals lasting 100 msec. Two cars travel 10 meters in one second at a speed of 1 m/sec. Similarly, all the pedestrians are traveling 11 meters at a speed of one m/sec. For each 100 msec interval, 1 meter is travelled by cars and 0.1 meter by pedestrians.
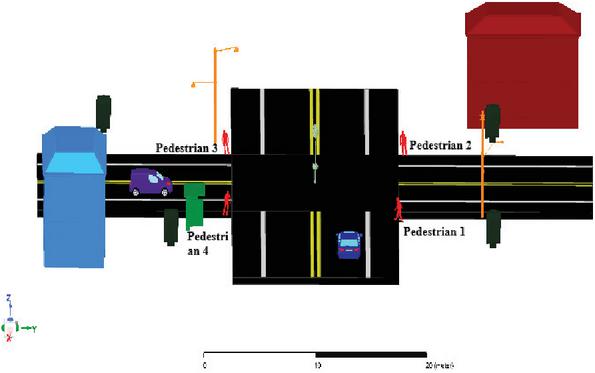
Figure 1 Realistic urban V2X scenario.
2.2 Shooting and Bouncing Rays (SBR+) Solver
Ansys HFSS SBR+, an asymptotic high-frequency electromagnetic (EM) simulator [13, 14] is used as a solver in our simulations. It models EM interactions in electrically large environments by employing the Shooting and Bouncing Rays (SBR+) method to compute EM solutions rapidly. SBR+ computes installed antenna performance, extended near-field distributions, and far-field radiation patterns for electrically large platforms with minimal computational resources [15]. Antennas operating on large host platforms can experience significant performance degradation due to EM interaction with the host structure. SBR+ facilitates the simulation and study of installed antenna applications, including antennas mounted on buildings or cars and dynamic complex environment scenarios involving several vehicles.
2.3 Parametric Analysis and Optimization
Parametric analysis in Ansys HFSS SBR+ simulates the time-varying scenario for each periodic modification. One or more variables are defined for sweep definitions in the analysis, each specifying a range of variable values. In this case, parametric analysis computes the installed TX and RX antenna interactions concerning the surrounding environment (such as trees, buildings, and lights) for every change and time interval. All the design variations optimetrics instructs the software to solve are specified in parametric configuration. Optimetrics solves the design, calculates the received power (dB), and determines the antenna coupling parameters.
3 Antennas and Gain Plots
3.1 Linearly polarized antenna array
A two-by-two square MPA array with coaxial probe feed [16] is used as an LPA. The design and simulation are conducted using Ansys HFSS Design 2024 R1; the patch antenna resonates at 28 GHz. This antenna is mounted on a Rogers RT-droid 5880 substrate, notable for its dielectric constant of 2.2 and thickness of 0.8 mm. The other design parameters and specifications of the single element are listed in Table 1.
Table 1
| LPA Design parameters for a single element | |
| Parameter | Value (mm) |
| Length and Width of Substrate | 5.4 |
| Length and Width of Top Ground | 5.4 |
| Length and Width of Bottom Ground | 5.4 |
| Length and Width of Patch | 3.1 |
| Coax Feed Length | 0.8 |
| Coax Inner Radius | 0.1 |
| Patch Spacing | 0.625 |
| Radome Height | 2 |
| Radome Thickness | 0.5 |
| Number of Vias | 32 |
| Vias Radius | 0.2 |
| Vias Height | 0.8 |
| Vias Position | 2.5, 2.5, 0 |
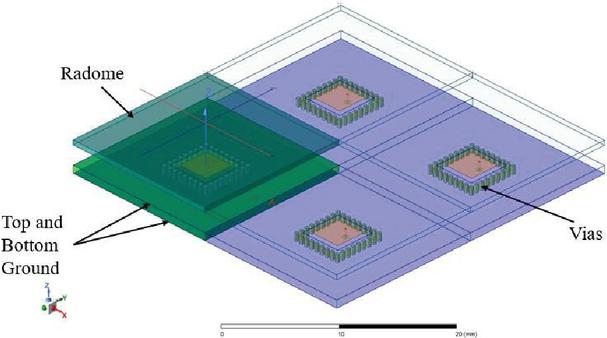
Figure 2 Two-by-two square patch antenna array at 28 GHz.
Figure 2 displays the 28 GHz 5G square patch antenna with radome arranged in a two-by-two array [16]. A radome is a protective cover placed over the antenna; its primary purpose is to protect it from environmental factors such as rain, wind, and physical damage. In 5G applications, especially outdoors, the radome is crucial for maintaining consistent performance over time. The antenna has two grounds: one at the top and one at the bottom. These two ground planes in a patch antenna array are essential in offering mechanical support, impedance matching, minimizing surface waves, and controlling operation by providing isolation and shielding. Since the antenna contains multiple layers, vias are essential for interconnecting these layers; they connect the patch or other layers to the ground plane.
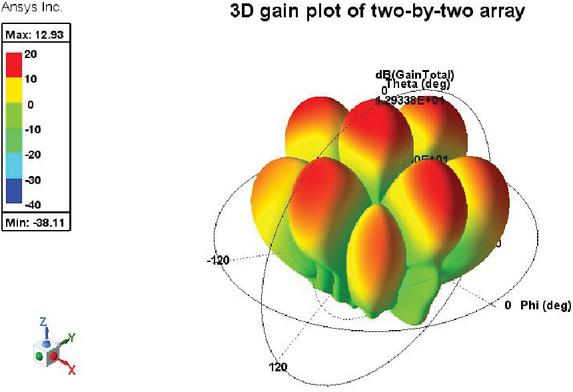
Figure 3 3-D gain plot of LPA.
3.2 Gain Plots
Figure 3 shows the 3D gain plot of the two-by-two antenna array. The peak gain of the antenna array is 12.93 dB. Figure 4 shows the 2D gain plots of the array for azimuth and (b) elevation planes. The azimuth plane pattern displays the antenna gain in the plane parallel to the ground (XY-plane) when the elevation angle is fixed at 90∘. It is a polar plot with gain plotted against azimuth angle (), which offers details on the antenna’s radiation patterns in various azimuthal directions ( ranging from 0∘ to 360∘). The elevation plane is orthogonal to the ground plane, say either the YZ-plane ( deg) or the XZ-plane (). Gain versus elevation angle () is plotted in a polar plot to illustrate how the antenna radiates above and below the horizontal plane as the changes.
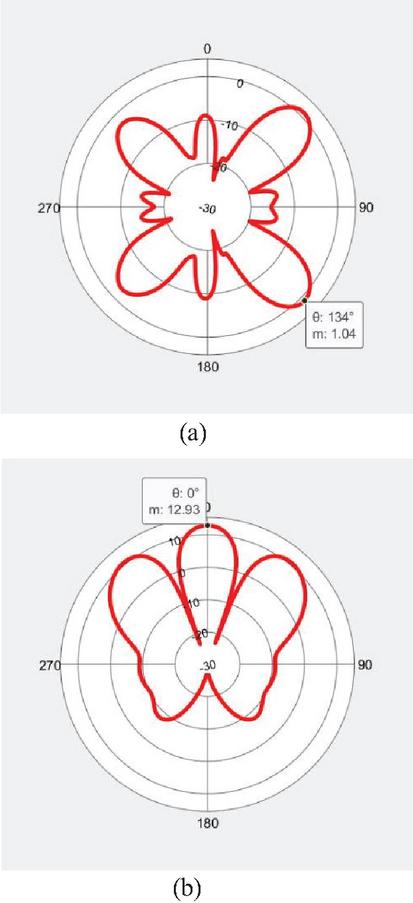
Figure 4 2D gain plots of the array (a) Azimuth plane pattern. (b) Elevation plane pattern.
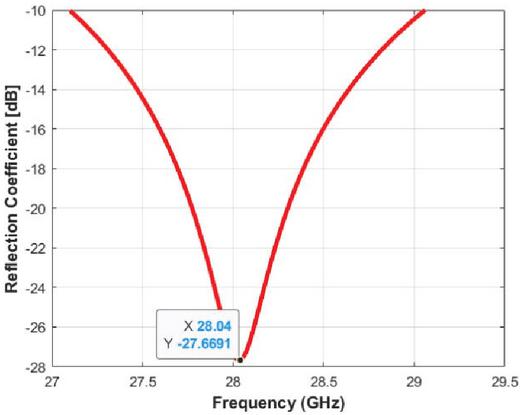
Figure 5 Reflection coefficient of the antenna.
The simulated for the proposed antenna, as illustrated in Figure 5 confirms its acceptable performance across a bandwidth from 27 to 29 GHz. Furthermore, the measured peak minimum value (dip) is approximately 27.6 dB at 28.04 GHz, highlighting the antenna’s high efficiency in radiating and receiving electromagnetic signals throughout the frequency range. The antenna’s performance highlights its potential for applications requiring high frequency operation and larger bandwidth, particularly in V2X communications where reliable and efficient signal transmission is critical.
4 MRT Beamforming
MRT is a signal processing technique used to increase the performance and reliability of data transmission. Maximal Ratio Combining (MRC) is a traditional antenna diversity technique [18], where the signals from the multiple receive antennas are weighted such that the signal-to-noise ratio (SNR) of their sum is maximized in the absence of interference, or when interference is treated as background noise. MRT is the dual of MRC [19] at the transmitter side, i.e. the transmit antenna weights are matched to channel fading. It is used to direct the transmission in specific directions. This is done by adjusting the phase and amplitude of the signals sent from multiple antennas, which can lead to constructive interference in the desired direction and destructive interference in others. MRT requires knowledge of the Channel State Information (CSI) at the transmitter. The CSI represents the channel properties between each transmitter and receiver antenna pair. The MRT algorithm uses this information to adjust the phase and amplitude of the transmitted signals to maximize the received signal power [19].
The core idea of MRT is to align the transmitted signals from multiple antennas so that they add constructively at the receiver. By knowing the channel, the transmitter can apply complex weights to the signal to compensate for the channel effects, thereby ensuring that the signals combine coherently at the receiver. In our current system one transmitter (TX) with 4 antennas and elements and one receiver (RX) with a single antenna element is present. The formulation of MRT weights for this case as shown below [20].
By concatenating users, the channel matrix results in
| (1) |
Since the system employs single-antenna users, the received signal for each user can be stacked in a single received vector.
| (2) |
where is the Additive White Gaussian noise (AWGN) at the receiver.
In MRT, the transmitted signals are weighted versions of the original signal :
| (3) |
where and are vector of user symbols and precoder matrix respectively.
The precoder matrix can be written as:
| (4) |
are the complex weights applied to the transmitted signal . The objective is to choose the weights. such that the received signal is maximized. The optimal weights are chosen as
| (5) |
is the complex conjugate of the channel coefficient .
is the norm of the channel vector.
This choice of weights maximizes the SNR at the receiver.
The received signal then becomes:
| (6) |
Substituting Equation (5) into Equation (6)
| (7) |
Since the received signal simplifies to:
| (8) |
| (9) |
This shows that the signal at the receiver is maximized by a factor of , which is the norm of the channel vector, thus maximizing the SNR at the receiver.
5 Power Distribution Across the Prediction Area
5.1 Without MRT at TX
Without an MRT precoder, the power distribution over a 5 m 5 m square area with 10 sample points at the 0.8 m pedestrian hand height is simulated. The results are only acquired at three-time intervals rather than eleven (as in the upcoming section) seconds to reduce computation time. To examine the power distributions, beginning, middle, and finishing time intervals – that is, 0 seconds, 0.5 seconds, and 1 second – are taken. The power distribution rectangle contour plots acquired and superimposed at the corresponding pedestrians are displayed in Figures 6, 7, and 8. These graphs give the power density over the region by determining the power transmitted by the TX at each location.
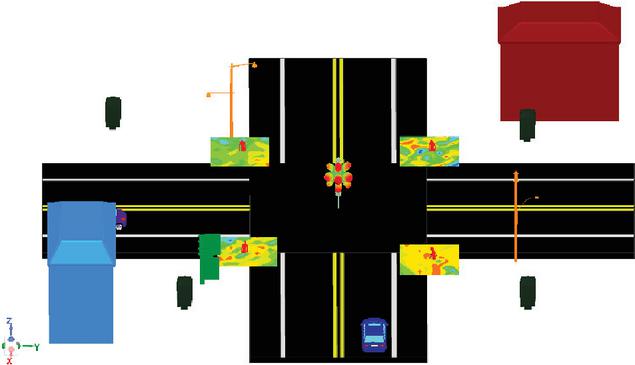
Figure 6 Power distribution without the usage of an MRT precoder at TX to every pedestrian at interval of 0 sec.
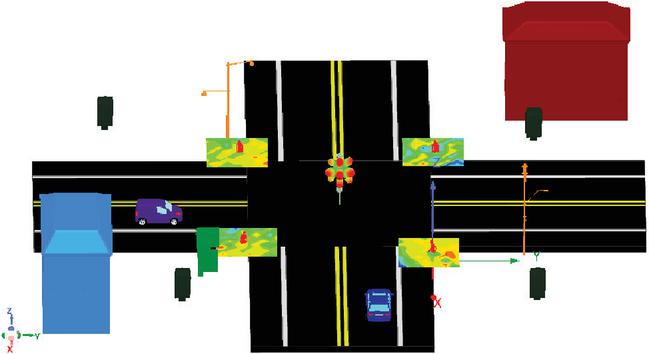
Figure 7 Power distribution without the usage of an MRT precoder at TX to every pedestrian at interval of 0.5 sec.
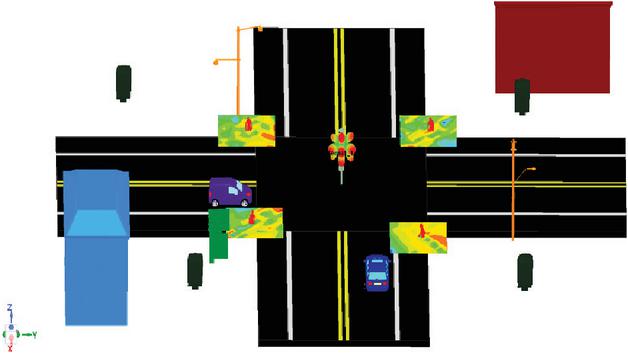
Figure 8 Power distribution without the usage of an MRT precoder at TX to every pedestrian at interval of one second.
5.2 With MRT at TX
The same procedure was performed when applying the MRT precoder to the TX and observing the plots at these three intervals. Evidently, when the MRT precoder is used, the plots exhibit a higher power density. The highest power distribution for the three-time slots has been observed compared to the scenario in which MRT is not implemented.
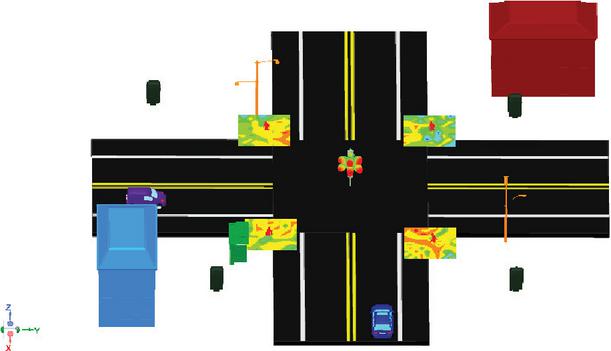
Figure 9 Power distribution using an MRT precoder at TX to every pedestrian at a time interval of 0 seconds.
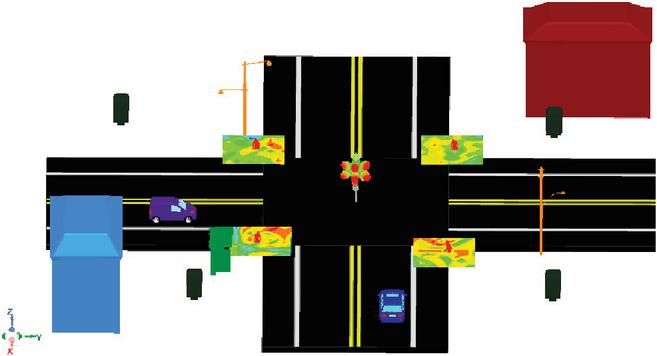
Figure 10 Power distribution using an MRT precoder at TX to every pedestrian at a time interval of 0.5 seconds.
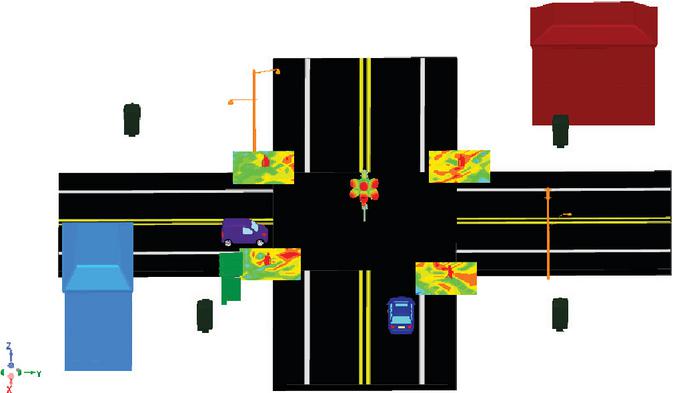
Figure 11 Power distribution using an MRT precoder at TX to every pedestrian at a time interval of 1 second.
6 Comparison of Received Power with and Without MRT
Received power is determined at each pedestrian location before and after the application of MRT at eleven time slots ranging from 0 to 1 seconds to obtain an accurate measurement with metrics.
Pedestrians 1 and 4 are subject to the MRT algorithm because they face the TX, while pedestrians 2 and 3 are situated behind the TX. By calculating the weights for each pedestrian individually and placing them at the TX antenna, the MRT precoder maximizes the signal transmission to both pedestrians. The simulated received power comparison plots with and without MRT are displayed below in Figures 12 and 13:
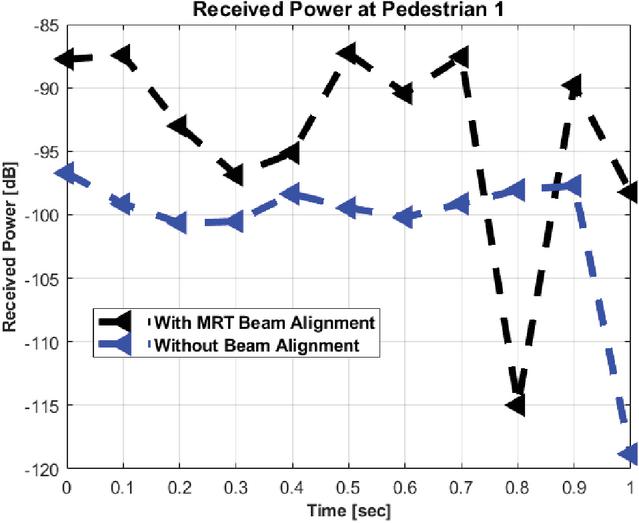
Figure 12 Comparison of received power values with and without MRT at Pedestrian 1.
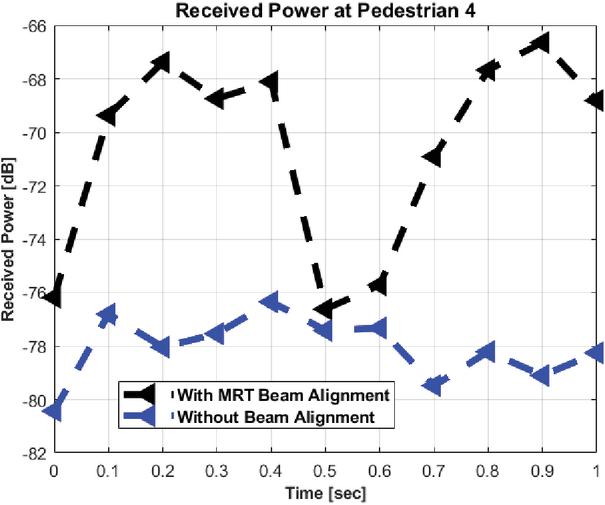
Figure 13 Comparison of received power values with and without MRT at Pedestrian 4.
Table 2
| Comparison of average received power at pedestrians with and without MRT | ||
| Pedestrian 1 | Pedestrian 4 | |
| Average power with MRT (dB) | 93.49 | 70.56 |
| Average power without MRT (dB) | 100.78 | 78.08 |
| Difference value | 7.2 | 7.5 |
Table 2 compares the average received power at pedestrian locations before and after MRT. It clearly shows that, following the MRT application, the average received power for both pedestrians has increased to about 7 dB. MRT guarantees optimal signal reception for most temporal instants. Consequently, pedestrians can ensure the best possible signal reception despite reflections and multipath interference by using the MRT.
7 Conclusion
Enhancing signal reception at the pedestrian level is critical for improving the performance and reliability of wireless communication systems, particularly in urban environments where obstacles and multipath effects can degrade signal quality. In an urban V2X environment, this study compared the functionality of MRT signal preprocessing applications at pedestrian crosswalks. The received signal power and power distributions are evaluated with and without MRT. According to this investigation, using MRT has enhanced the signal power reception by an average of 7 dB for pedestrians. And the maximum signal reception is consistently seen across 1 second. Implementing MRT algorithms further improves signal reception by optimizing the transmission power distribution, focusing energy on the desired direction, and enhancing overall signal strength and quality for pedestrians.
References
[1] Spotlight on Highway Safety; Pedestrian Traffic fatalities by State; Technical Report; Governors Highway Safety Association (GHSA) Annual Meeting 2023; Connecting Communities: Putting Vision Zero into Action, New York, NY.
[2] “Connected vehicle safety pilot program,” https://www.its.dot.gov/factsheets/pdf/SafetyPilot final.pdf.
[3] Xinzhou Wu, Radovan Miucic, Sichao Yang, “Cars Talk to Phones: A DSRC Based Vehicle-Pedestrian Safety System,” 2014 IEEE 80th Vehicular Technology Conference (VTC2014-Fall), Vancouver, BC, Canada, 2014, pp. 1–7.
[4] X. Wu, S. Subramanian, R. Guha, R. White, J. Li, K. Lu, A. Bucceri, and T. Zhang, “Vehicular communications using dsrc: challenges, enhancements, and evolution,” 2013.
[5] R. Miucic and S. Bai, “Vehicle-to-pedestrian cooperative safety application,” accepted for publication at ITS WC 2014.
[6] Sara El Hamdani, Nabil Benamar, Mohamed Younis, “Pedestrian Support in Intelligent Transportation Systems: Challenges, Solutions and Open issues,” in Proceedings of the Transportation Research Part C: Emerging Technologies, Volume 121, December 2020, 102856.
[7] P. Li, K. Wu, Y. Cheng, S. T. Parker and D. A. Noyce, “How Does C- V2X Perform in Urban Environments? Results From Real-World Experiments on Urban Arterials,” in IEEE Transactions on Intelligent Vehicles, vol. 9, no. 1, pp. 2520–2530, Jan. 2024.
[8] M. Bonato, et al., “Assessment of sar in road-users from 5g-v2x vehicular connectivity based on computational simulations,” Sensors, vol. 22, no. 17, p. 6564, Aug. 2022.
[9] T. S. Rappaport, et al., “Millimeter wave mobile communications for 5G cellular: It will work!” IEEE access, vol. 1, pp. 335–349, May. 2013.
[10] C. Kykkotis, P. S. Hall, R. A. Lewis, and A. D. Searle, “Millimetre wave antennas for future vehicle communications,” in IEEE 49th Veh. Technol. Conf., vol. 2, pp. 1585–1588, IEEE, May. 1999.
[11] D. Rongas, A. Paraskevopoulos, L. Marantis, and A. G. Kanatas, “An integrated shark-fin reconfigurable antenna for V2X communications,” Prog. Electromagn. Res., vol. 100, pp. 1–16, Feb. 2020.
[12] M. U. Khan, M. S. Sharawi, and R. Mittra, “Microstrip patch antenna miniaturisation techniques: a review,” IET Microw. Antennas Propag., vol. 9, no. 9, pp. 913–922, Jun. 2015.
[13] ANSYS, Inc. (2018). “ANSYS HFSS SBR+ [White paper].” https://www.ansys.com/content/dam/resource-center/application-brief/ansys-sbr-plus.pdf.
[14] A. P. Sligar, ‘Machine learning-based radar perception for autonomous vehicles using full physics simulation,’ IEEE Access, vol. 8, pp. 51470–51476, 2020.
[15] ANSYS, Inc. Installed Performance Modeling & Simulation for Antennas “A good antenna, righteously placed…” Advanced Modeling & Simulation (AMS) Seminar Series NASA Ames Research Center, February 18, 2020. https://www.nas.nasa.gov/assets/nas/pdf/ams/2020/AMS_20200218_Carpenter.pdf.
[16] ANSYS, Inc. “How to Design Base Station (or Microcell) Antenna Arrays for 5G Wireless Networks [White paper].” https://www.ansys.com/content/dam/resource-center/application-brief/wp-how-to-design-base-station-or-microcell-antenna-arrays-for-5g-wireless-networks-v2.pdf.
[17] J. Winters, “Optimum combining in digital mobile radio with cochannel interference,” IEEE Trans. Veh. Technol., vol. 2, no. 4, pp. 528–539, Aug. 1984.
[18] T. K. Y. Lo, “Maximum ratio transmission,” IEEE Trans. Commun., vol. 47, no. 10, pp. 1458–1461, Oct. 1999.
[19] Zhang, Y., Gao, J. and Liu, Y. MRT precoding in downlink multi-user MIMO systems. J Wireless Com Network 2016, 241 (2016).
[20] Zakia, “Maximizing the Sum Rate of Massive MIMO with Rectangular Planar Array and MRT Beamforming,” 2019 IEEE 89th Vehicular Technology Conference (VTC2019-Spring), Kuala Lumpur, Malaysia, 2019, pp. 1–5.
Biographies

Sai Radha Abhigna Maturi is PhD Student in the Department of Electrical and Computer Engineering and working as a Graduate Teaching Assistant at University of Arkansas at Little Rock, United States, since August 2022. Completed Master of Technology in Communication and Radar Systems Engineering from Koneru Lakshmaiah Education Foundation, India in May 2020 and received a Silver Medal for academic performance. She published a Journal paper in Acta Geophysica as a main author in her Master’s degree as a part of Indian Space Research Organization (ISRO) sponsored project. Her current and previous research areas include Beamforming of Antennas, Massive MIMO, V2X, V2I, V2V, effects of ionosphere on GPS, GNSS.

Hussain Al-Rizzo received his PhD in Electrical and Computer Engineering from the University of New Brunswick, Canada. In 2000, he joined the Systems Engineering Department at the University of Arkansas at Little Rock, where he is currently a Professor of Telecommunication Systems Engineering. He has published over 300 papers in peer-reviewed journals and conference proceedings, two books, eight book chapters, and four patents. His research areas include V2V, V2X, and V2I wireless systems; smart antennas; massive MIMO; flexible RF components and antennas; implantable medical devices; electromagnetic wave scattering by complex objects; design, modeling, and testing of high-power microwave applicators; precipitation effects on GPS; terrestrial and satellite frequency re-use communication systems; field operation of NAVSTAR GPS receivers; data processing and accuracy assessment; and effects of the ionosphere, troposphere, and multipath on code and carrier-beat phase GPS observations.

Nijas Kunju received MSc (2009) and PhD (2015) in Electronics Science from Cochin University of Science and Technology, Cochin, Kerala under supervision of Prof. P Mohanan. He is currently working as Technical Manager at ANSYS Inc. He is specialized in the domain of RF, Antennas, Radar, Signal Integrity, Power Integrity, and Multiphysics simulation. Before he joined ANSYS he was working as Research Consultant in GE Global Research in Bangalore on the area of microwave material sensing for detecting different materials in Crude Oils. He holds 20+ International publications and 20+ national and international conference publications.