A Comparative Analysis of 3GPP and ITU-R 5G Channel Models: Technical Divergence and Philosophical Implications
Nicolò Avarino*, Christos Politis and Nuwan Weerasinghe
School of Computer Science and Engineering, Kingston University, London, UK
E-mail: nicoloavarino@icloud.com
*Corresponding Author
Manuscript received 21 November 2025, accepted 05 December 2025, and ready for publication 31 December 2025.
© 2025 River Publishers
DOI. No. 10.13052/2794-7254.021
Abstract
The design and validation of 5G systems rely heavily on standardized radio channel models to predict real-world performance. The 3GPP TR 38.901 and the ITU-R M.2412 reports are the industry’s cornerstones for this purpose, yet they exhibit significant technical differences, particularly in the sub-6 GHz frequency band and millimeter-wave indoor scenarios. This paper presents a rigorous comparative study of these two standards, quantifying the performance impact of their divergences across canonical deployment scenarios. Using a unified simulation framework implemented in ns-3, we analyze pathloss and Signal-to-Noise Ratio (SNR) in Rural Macro (RMa), Urban Macro (UMa), Urban Micro (UMi), and Indoor Hotspot (InH) environments.
Our results reveal that while the models align in rural scenarios, they diverge fundamentally in complex urban environments. The ITU-R model proves to be a more conservative benchmark in UMa NLOS, predicting a median SNR up to 9.5 dB lower than 3GPP. Conversely, in UMi NLOS, the 3GPP model describes a significantly more volatile channel (higher shadow fading variance), making it a risky predictor for Ultra-Reliable Low-Latency Communications (URLLC). Furthermore, our analysis of the indoor 28 GHz scenario exposes a dramatic discrepancy: the ITU-R’s optional model is exceptionally optimistic, showing a performance gap of up to 34 dB compared to the standard 3GPP model. We conclude that these technical divergences reflect differing design philosophies – optimistic prediction vs. conservative benchmarking – dictating that model selection must be strategically aligned with the specific 5G service pillar (eMBB or URLLC) under evaluation.
Keywords: 5G, channel modeling, 3GPP TR 38.901, ITU-R M.2412, ns-3, pathloss, SNR, URLLC, eMBB.
1 Introduction
The fifth generation of mobile communications (5G), categorized under the IMT-2020 vision, marks a paradigm shift from traditional mobile broadband to a diverse ecosystem of services. As defined by ITU-R Recommendation M.2083 [1], 5G is built upon three distinct pillars: Enhanced Mobile Broadband (eMBB), focusing on high data rates (up to 20 Gbit/s) and mobility; Massive Machine-Type Communications (mMTC), targeting high-density IoT connectivity; and Ultra-Reliable and Low-Latency Communications (URLLC), enabling mission-critical applications with sub-millisecond latency and 99.999% reliability.
Designing networks that meet these varied and stringent requirements necessitates highly accurate channel modeling. The adoption of millimeter-wave (mmWave) frequency bands introduces complex propagation characteristics, such as high free-space path loss, extreme sensitivity to blockage, and sparse scattering, which challenge conventional sub-6 GHz modeling approaches [2]. Accurate simulation tools are therefore vital for predicting key metrics like coverage, throughput, and reliability before physical deployment [3].
Currently, the two industry-standard frameworks for 5G channel modeling are the 3GPP TR 38.901 [4] and the ITU-R M.2412 [5] reports. While the ITU-R model builds upon the 3GPP specification, it introduces significant modifications, particularly in pathloss formulations for the sub-6 GHz band and new statistical distributions for angular spreads. However, the practical impact of these technical divergences on system-level performance is not always fully quantified. Model selection is often treated as a minor configuration detail, yet it can fundamentally alter simulation outcomes and, consequently, network design decisions.
This paper presents a rigorous comparative study of the 3GPP and ITU-R channel models. We implement the ITU-R M.2412 model within the ns-3 network simulator, creating a unified framework to benchmark it against the established 3GPP implementation. We analyze performance across four canonical scenarios: Rural Macro (RMa), Urban Macro (UMa), Urban Micro (UMi), and Indoor Hotspot (InH). Our primary objective is to quantify the differences in pathloss and Signal-to-Noise Ratio (SNR) and to interpret these divergences through the lens of the different service requirements (eMBB vs. URLLC).
The remainder of this paper is organized as follows: Section 2 details the technical differences between the two channel models. Section 3 describes our simulation framework in ns-3. Section 4 presents the comparative analysis of pathloss and SNR. Section 5 discusses the philosophical implications of the results for 5G service pillars, and Section 6 concludes the paper.
2 Overview of Channel Models
The relationship between the 3GPP TR 38.901 [4] and ITU-R M.2412 [5] channel models is one of foundation and refinement. The 3GPP model provides a comprehensive baseline for frequencies from 0.5 to 100 GHz. The ITU-R model adopts this baseline but introduces a bifurcated architecture based on frequency, along with specific modifications for indoor millimeter-wave scenarios.
2.1 Architectural Framework: Model A vs. Model B
While 3GPP defines a single, continuous framework across the frequency spectrum, ITU-R M.2412 introduces a distinction:
• Model B (6–100 GHz): For frequencies above 6 GHz, the ITU-R explicitly aligns with the 3GPP specification. Pathloss formulas, line-of-sight (LOS) probabilities, and fast-fading parameters are identical.
• Model A (0.5–6 GHz): For the lower frequency bands, which are critical for wide-area 5G coverage (e.g., 700 MHz, 3.5 GHz), ITU-R introduces distinct formulations.
2.2 Scenarios of Consensus and Alignment
Before analyzing the divergences, it is crucial to identify where the standards harmonize.
2.2.1 Rural macro (RMa)
For the Rural Macro scenario, the ITU-R does not introduce a unique formulation. It explicitly adopts the pathloss equations and fading parameters defined in 3GPP TR 38.901 for both LOS and NLOS conditions. The only minor distinction is the applicability range: ITU-R extends the validity distance up to 21 km, whereas 3GPP typically defines it up to 10 km. Mathematically, however, the models are identical.
2.2.2 Standard indoor hotspot (InH)
For standard office environments in the sub-6 GHz band, the ITU-R introduces specific “InH-A” formulas. While technically distinct from the generic 3GPP equations, they are designed to yield functionally equivalent results. The mean pathloss trends and shadow fading parameters (e.g., dB) are largely harmonized, reflecting a consensus on the propagation physics within standard buildings.
2.3 Critical Pathloss Divergences
The most impactful technical differences arise in urban environments and specific mmWave use cases.
2.3.1 Urban Macro (UMa) NLOS
The 3GPP model employs a generalized distance-dependent formula. In contrast, the ITU-R Model A incorporates specific environmental geometry. The 3GPP formula relies primarily on 3D distance (), carrier frequency (), and user terminal height ():
| (1) |
The ITU-R formula is significantly more complex, introducing sensitivity to the average building height () and street width ():
| (2) |
This complexity aims to model diffraction loss over rooftops more explicitly than the regression-based 3GPP approach.
2.3.2 Urban micro (UMi) NLOS
In the street canyon environment, the models diverge in their regression coefficients and, crucially, in their statistical variance. The mean pathloss formulas differ in slope and intercept:
| (3) |
| (4) |
However, the most significant difference for system reliability is the Shadow Fading (SF) standard deviation (). The 3GPP standard specifies a high dB, implying a highly volatile channel. The ITU-R standard specifies a much lower dB, describing a more stable environment.
2.3.3 Indoor 28 GHz optional model
For indoor mmWave scenarios, ITU-R introduces “Optional Model I”, a simplified deterministic model based on 2D distance ():
| (5) |
This model ignores the height component () and assumes a very low shadow fading variance compared to the full 3GPP stochastic model, representing an idealized propagation environment.
2.4 Small-Scale Fading and Angular Distributions
Beyond pathloss, the models differ in how they generate multipath components (Fast Fading). Small-scale fading is typically modeled according to classical distributions, as described in [6].
2.4.1 The Laplacian innovation
A major novelty in ITU-R M.2412 is the mandate to use the Laplacian distribution for the Power Angular Spectrum (PAS) of zenith angles (ZOD/ZOA) in sub-6 GHz scenarios, whereas 3GPP exclusively uses the Wrapped Gaussian distribution [7].
• Gaussian (3GPP): Symmetric, thin tails. Assuming scattering clusters are concentrated around a mean direction.
• Laplacian (ITU-R): Sharper peak, heavier tails. This models environments where strong reflections can occur at angles significantly offset from the main direction.
Table 1 summarizes these key technical characteristics.
Table 1
| Summary of technical characteristics (sub-6 GHz) | ||
| Feature | 3GPP TR 38.901 | ITU-R M.2412 |
| RMa and InH LOS | Baseline | Identical Aligned |
| UMa NLOS | Simplified Formula | Complex Formula |
| UMi NLOS | High (7.82 dB) | Low (4.0 dB) |
| Zenith Angles | Wrapped Gaussian | Laplacian |
| Indoor mmWave | Full Stochastic | Optional Simplified (2D) |
3 Simulation Methodology
To conduct a fair and rigorous comparison, we developed a unified simulation framework within the Network Simulator 3 (ns-3) environment. ns-3 is a discrete-event network simulator widely used in academia and industry for 5G research. While ns-3 natively includes a robust implementation of the 3GPP TR 38.901 channel model, it lacks the specific modifications introduced by ITU-R M.2412. Therefore, our primary methodological contribution was the extension of the ns-3 propagation module to incorporate the ITU-R specifications.1
3.1 Framework Architecture
Our implementation extends the existing ns-3 architecture by introducing new classes that inherit from the core Propagation LossModel and ChannelConditionModel. Our simulation framework was informed by the WWRF-IEG evaluation of IMT-2020 candidate technologies [8]. This modular approach ensures that the only variable in our comparative study is the channel model definition itself; the underlying simulation engine, mobility models, and antenna arrays remain consistent.
Key features implemented include:
• Dual-Mode Pathloss Engine: A logic switch that applies either “Model A” (ITU-R sub-6 GHz formulas) or “Model B” (standard 3GPP formulas) based on the carrier frequency and scenario.
• Laplacian Angular Distribution: We modified the channel generation procedure to support the Laplacian distribution for zenith angles (ZOD/ZOA) as mandated by ITU-R, alongside the standard Wrapped Gaussian distribution.
• Scenario-Specific Parameters: We integrated the complete set of fast-fading parameters (delay spread, angular spread, cross-correlations) from the ITU-R M.2412 report.
3.2 Simulation Configuration
All simulations were configured according to the “Evaluation configurations for test environments” specified in ITU-R M.2412. We simulated single-link performance with a channel bandwidth of 20 MHz. The key parameters for each of the four scenarios are summarized in Table 2.
Table 2
| Simulation configuration parameters (ITU-R M.2412) | ||||
| Parameter | InH | UMi | RMa | UMa |
| Carrier Freq. | 4 GHz | 4 GHz | 700 MHz | 700 MHz |
| BS Height | 3 m | 25 m | 35 m | 25 m |
| UE Height | 1.5 m | 1.5 m | 1.5 m | 1.5 m |
| Tx Power | 24 dBm | 44 dBm | 49 dBm | 49 dBm |
| UE Noise Fig. | 7 dB | 7 dB | 7 dB | 7 dB |
| Thermal Noise | 174 dBm/Hz | |||
3.3 Evaluation Scenarios and Metrics
We evaluated performance in two distinct propagation conditions for each scenario:
• Line-of-Sight (LOS): The receiver moves away from the transmitter in a straight line (10 m to 100 m) with a clear optical path.
• Non-Line-of-Sight (NLOS): The receiver is positioned at a distance where the LOS probability is negligible (e.g., 900 m for UMa), ensuring that the channel is dominated by multipath and obstructions. Shadow fading is enabled to capture large-scale signal variations.
Our comparison relies on two primary metrics:
1. Pathloss vs. Distance: This validates the correctness of the large-scale attenuation models and visualizes the mean signal decay predicted by each standard.
2. Signal-to-Noise Ratio (SNR) CDF: The Cumulative Distribution Function of the SNR captures the combined effect of pathloss, shadow fading, and fast fading. It allows us to quantify link reliability (outage probability at the tail) and ergodic capacity (median SNR).
3.4 Limitations
To focus on the fundamental differences in channel modeling, certain complexities were simplified. Specifically, dynamic blockage (e.g., by moving vehicles) was not modeled, and isotropic antennas were used to isolate channel propagation effects from beamforming gains.
4 Results and Comparative Analysis
This section presents the comprehensive simulation results across four canonical deployment scenarios: Rural Macro (RMa), Urban Macro (UMa), Urban Micro (UMi), and Indoor Hotspot (InH). For each scenario, we first validate the pathloss models by comparing theoretical formulas against simulated data, and then analyze the Signal-to-Noise Ratio (SNR) Cumulative Distribution Functions (CDFs) to quantify system performance.
4.1 Rural Macro (RMa) Scenario
The RMa scenario serves as the validation baseline. Since ITU-R M.2412 explicitly adopts the 3GPP TR 38.901 formulas for rural environments at 700 MHz, we expect identical performance.
4.1.1 Pathloss Validation
As shown in Figure 1, the theoretical curves for 3GPP and ITU-R are perfectly superimposed for both Line-of-Sight (LOS) and Non-Line-of-Sight (NLOS) conditions. The simulated data points (Figure 2) align flawlessly with the theoretical predictions, confirming the correctness of the simulation framework implementation.
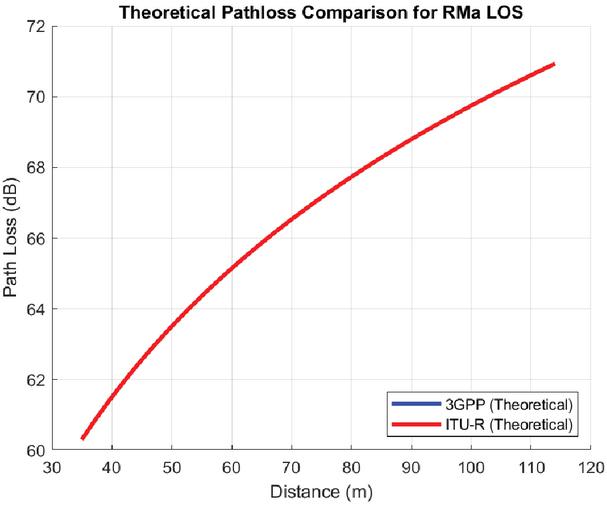
Figure 1 RMa LOS theoretical pathloss.
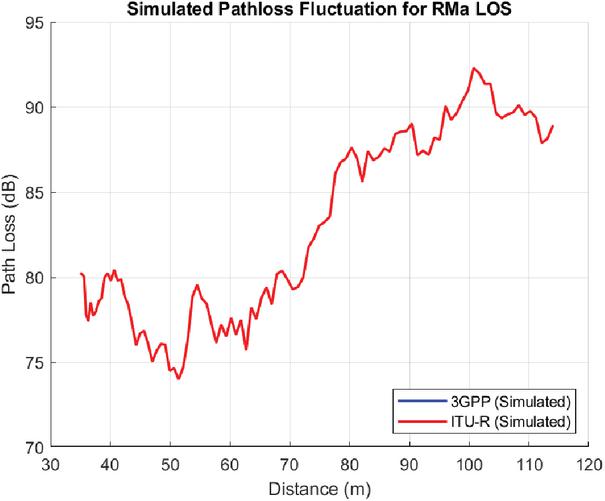
Figure 2 RMa LOS simulated data.
4.1.2 SNR analysis
Consequently, the SNR performance is identical. Figure 3 and 4 show a perfect overlap of the CDF curves. In LOS, the median SNR is approximately 68 dB, dropping to 19 dB in NLOS. This scenario confirms that where standards converge, the models yield indistinguishable results.
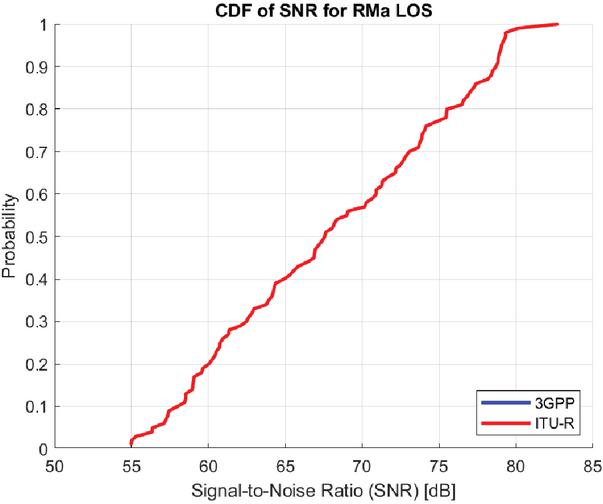
Figure 3 RMa LOS SNR CDF.
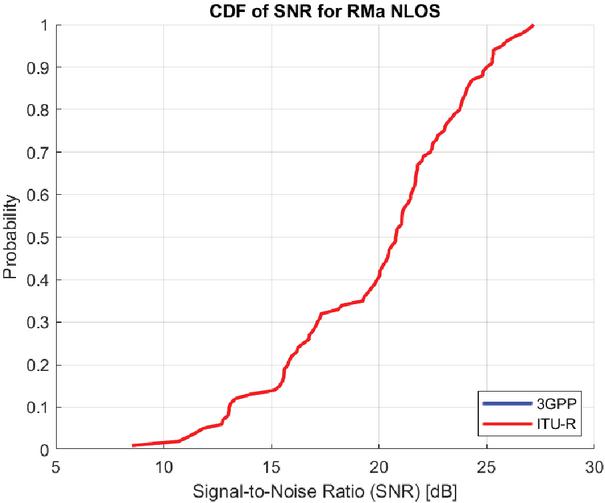
Figure 4 RMa NLOS SNR CDF.
4.2 Urban Macro (UMa) Scenario
In the UMa scenario, divergences appear due to the ITU-R’s specific “Model A” formulations for the sub-6 GHz band.
4.2.1 Pathloss validation
In LOS conditions, the models remain identical (Figures omitted for brevity as they mirror the RMa consensus). However, in NLOS conditions, a significant gap emerges. Figure 5 shows that the ITU-R model (red) predicts consistently higher pathloss than the 3GPP model (blue). While the simplified formulas might suggest a minimal difference, the full implementation reveals a gap often exceeding 10 dB due to environmental parameters like building heights incorporated in the ITU-R model.
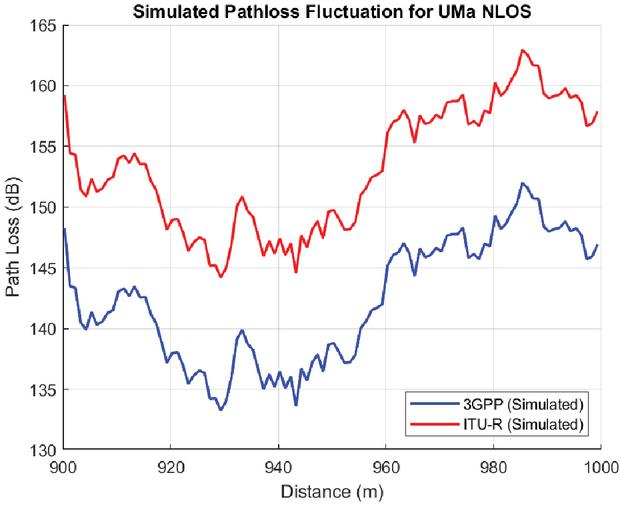
Figure 5 UMa NLOS simulated pathloss.
4.2.2 SNR analysis
In the LOS condition, the performance curves for 3GPP and ITU-R are practically identical (Figure 6). It is important to note that any minor behavioral variations observed in this state are not due to signal attenuation, but are solely attributable to slight differences in the fast-fading parameters (small-scale fading) defined by the two standards.
In contrast, the NLOS condition shows a dramatic divergence where pathloss dominates. The higher attenuation predicted by ITU-R directly degrades link quality. The SNR CDF in Figure 7 reveals a clear horizontal shift. The 3GPP model predicts a median SNR of 4.5 dB, whereas the ITU-R model predicts 5 dB. This 9.5 dB deficit in the ITU-R model implies a much higher outage probability, positioning it as a significantly more conservative benchmark for urban coverage compared to the 3GPP baseline.
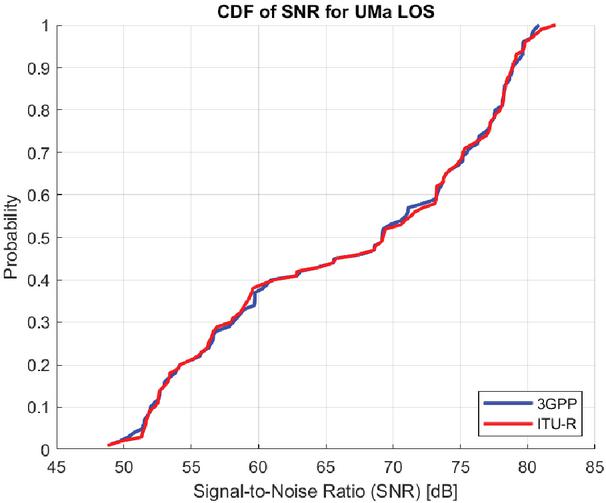
Figure 6 UMa LOS SNR CDF (identical).
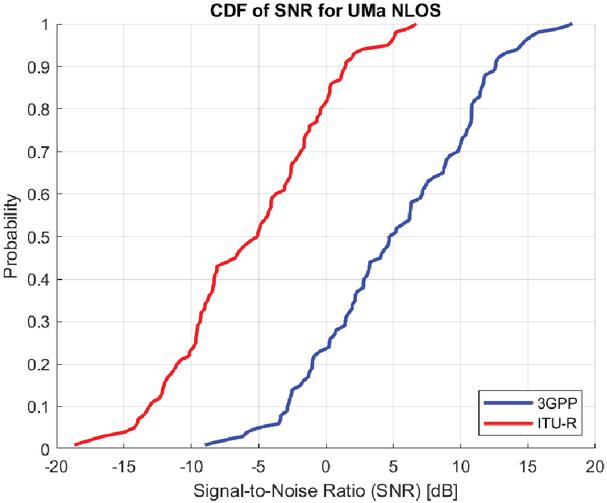
Figure 7 UMa NLOS SNR CDF (divergent).
4.3 Urban Micro (UMi) Scenario
The UMi “Street Canyon” scenario at 4 GHz exhibits the most complex behavior, with model superiority flipping between LOS and NLOS.
4.3.1 Pathloss validation
In LOS (Figure 8), the ITU-R model is more optimistic, predicting 2–3 dB lower pathloss than 3GPP. However, in NLOS (Figure 9), the relationship inverts: the ITU-R model becomes more pessimistic, predicting 5–7 dB higher pathloss. The simulation data confirms these trends.
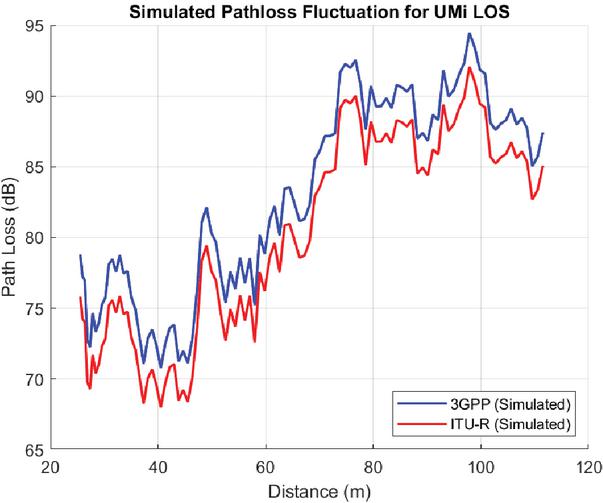
Figure 8 UMi LOS simulated pathloss.
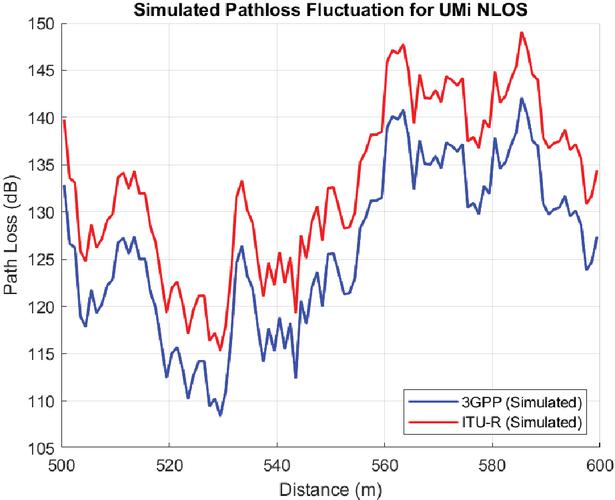
Figure 9 UMi NLOS simulated pathloss.
4.3.2 SNR analysis and the capacity-reliability trade-off
The SNR analysis for the UMi scenario provides the most critical insight of this comparative study. While the LOS condition follows the pathloss trend (ITU-R slightly better), the NLOS condition reveals a fundamental trade-off driven by the statistical properties of the channel.
Figure 10 confirms the inversion observed in the pathloss analysis, but a closer examination of the Cumulative Distribution Function (CDF) shape reveals a complex behavior that can be analyzed in three distinct regions:
1. The Low-SNR Tail (Deep Fades): In the lower probability region (e.g., below 10%), the 3GPP curve (blue) exhibits a significantly shallower slope compared to the ITU-R curve (red). This “heavy tail” indicates a much higher probability of experiencing severe deep fades. For URLLC applications where reliability is paramount, this tail behavior is critical: the 3GPP model predicts that the link is more prone to catastrophic drops in quality, making it a more volatile environment.
2. The Median Region (Average Capacity): In the central portion of the distribution (probability between 20% and 80%), the 3GPP curve is shifted horizontally to the right. Specifically, the 3GPP model predicts a median SNR of approximately 13 dB, compared to 8 dB for the ITU-R model. This 5 dB advantage implies that for standard eMBB services, which rely on ergodic capacity and retransmissions, the 3GPP model is decidedly more optimistic.
3. The High-SNR Tail (Signal Peaks): At the upper end of the distribution (above 90%), the 3GPP curve extends much further to the right. This suggests a higher likelihood of encountering exceptionally strong signal peaks, which opportunistic scheduling algorithms could exploit to maximize throughput.
The Root Cause: This distinct three-part behavior is a direct mathematical consequence of the different coefficients in their respective pathloss formulas:
| (6) |
| (7) |
However, the most critical finding here lies in the link reliability, which is governed by the shadow fading standard deviation, [9]. The 3GPP model specifies an extremely high value of 7.82 dB, compared to the moderate ITU-R value of 4.0 dB. This higher variance in the 3GPP model makes the channel fundamentally more volatile.
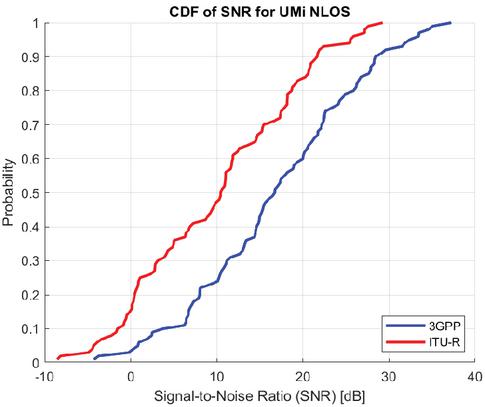
Figure 10 UMi NLOS SNR CDF. 3GPP shows higher median capacity but higher volatility (shallower slope) compared to ITU-R.
The SNR CDF in Figure 10 visualizes this trade-off. We can analyze its shape in three distinct regions:
1. The Low-SNR Tail (Deep Fades): In the region below approximately 8 dB, the 3GPP curve has a much shallower slope. This indicates a significantly higher probability of experiencing severe deep fades, a critical vulnerability for URLLC services.
2. The Median Region (Average Capacity): Between roughly 20% and 80% probability, the 3GPP curve is shifted to the right, reflecting its 5 dB advantage in median SNR and thus its higher ergodic capacity, favorable for eMBB.
3. The High-SNR Tail (Signal Peaks): Above approximately 27 dB, the 3GPP curve is again shallower. This means a higher probability of exceptionally strong signal peaks, which opportunistic eMBB services can exploit.
This three-part behavior is a direct mathematical consequence of the higher in the 3GPP model.
4.4 Indoor Hotspot (InH) Scenario
We analyzed the InH scenario in two configurations: standard sub-6 GHz (4 GHz) and the optional mmWave model (28 GHz).
4.4.1 Standard InH (4 GHz)
At 4 GHz, the models show only minor nuances. In LOS, ITU-R is marginally more optimistic (1 dB)(Figure 11). In NLOS, despite a theoretical crossover point in the pathloss formula, the simulated SNR performance is functionally identical (median SNR 43 dB), as shown in Figure 12.
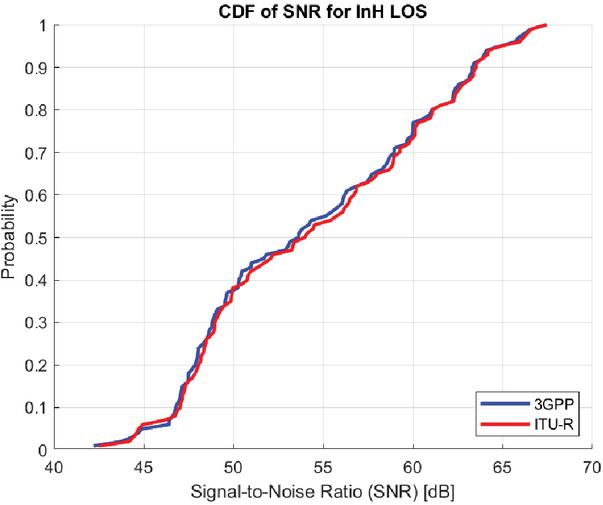
Figure 11 InH LOS SNR CDF (4 GHz).
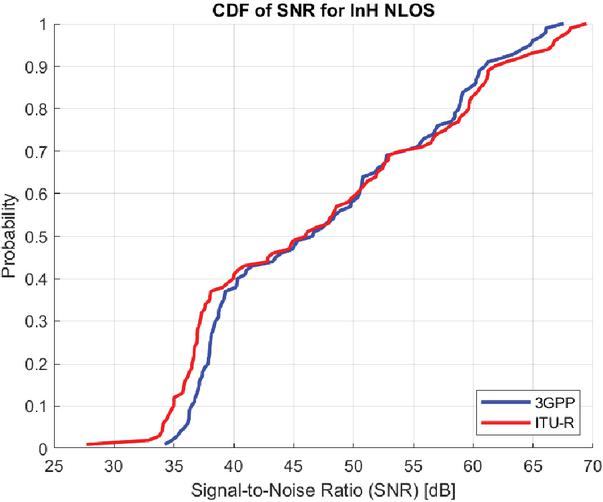
Figure 12 InH NLOS SNR CDF (4 GHz).
4.4.2 Optional model (28 GHz)
The contrast at 28 GHz is dramatic. We compared the standard 3GPP model against the ITU-R “Optional Model I”. Figure 13 demonstrates a massive divergence. The ITU-R optional model predicts significantly lower pathloss. This translates to the SNR CDFs in Figure 14. In NLOS, the ITU-R optional model predicts a median SNR of 58 dB, while the standard 3GPP model predicts only 24 dB. This 34 dB gap confirms that the ITU-R Optional Model is an idealized baseline that effectively ignores severe mmWave blockage effects.
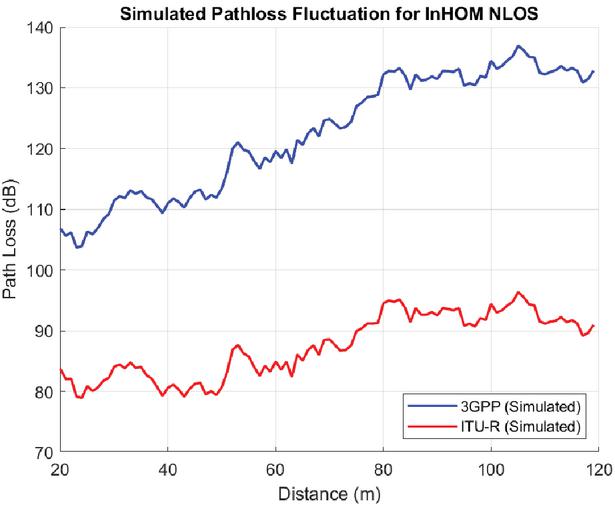
Figure 13 InH 28 GHz simulated pathloss.
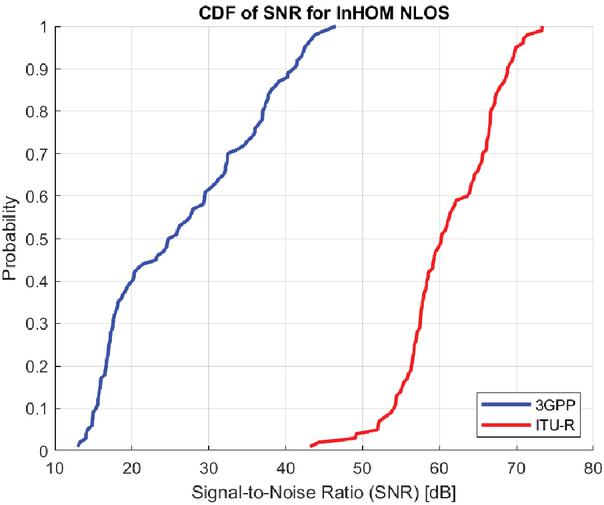
Figure 14 InH 28GHz SNR CDF.
5 Philosophical Implications for 5G Services
The comprehensive scenario-by-scenario analysis presented in Section 4 allows us to synthesize a broader conclusion regarding the design intent behind these standards.
It is crucial to frame this discussion within the genealogical relationship of the models. Since ITU-R M.2412 is explicitly derived from 3GPP TR 38.901, the differences we observed – especially the variance in and the resulting SNR slope – are not merely statistical curiosities. They embody two distinct philosophies of system design. Consequently, the terms “optimistic” and “conservative” used here are relational characterizations, describing how ITU-R deliberately deviates from the 3GPP baseline.
5.1 Areas of Consensus: The Baseline Validation
The perfect alignment in the **Rural Macro (RMa)** scenario and the functional equivalence in the **Standard Indoor (InH)** scenario confirm that the ITU-R accepts the 3GPP baseline as valid for “well-understood” environments. In these contexts, the standardization bodies agree on the physics, and model selection has negligible impact on simulation outcomes.
5.2 3GPP: The Philosophy of Optimism (Trusting the System)
Relative to the ITU-R modifications, the foundational 3GPP model tends to yield results favorable for capacity-oriented services. This reflects an **optimistic philosophy**: it assumes that communication systems can adapt dynamically, exploit high-SNR moments, and recover from deep fades.
• Capacity Optimism: In UMi NLOS, despite high volatility, 3GPP predicts a higher median SNR (5 dB).
• Alignment with eMBB: This mindset fits naturally with **Enhanced Mobile Broadband (eMBB)**. In scenarios like video streaming, maximizing ergodic throughput is more important than guaranteeing every single packet. The “heavy tails” of the 3GPP model are acceptable because mechanisms like Hybrid ARQ (HARQ) and adaptive coding can bridge the gaps caused by deep fades [10].
Essentially, **3GPP trusts the system** to mitigate channel volatility, making it the appropriate choice for dimensioning maximum network capacity.
5.3 ITU-R: The Philosophy of Discipline (Testing the System)
In contrast, the specific formulas introduced by ITU-R (Model A) act as a rigorous benchmark, adopting a **conservative philosophy**. By introducing complex environmental variables in UMa and deliberately limiting variability in UMi (lower ), it ensures steadier and more predictable channel behavior.
• Stability in Reliability: The lower variance in UMi ( dB vs 7.82 dB) describes a stable channel. The “heavy tail” of the 3GPP model represents a non-negligible probability of catastrophic packet loss (outage), which is unacceptable for autonomous systems [11].
• Alignment with URLLC: This approach aligns directly with **Ultra-Reliable Low-Latency Communications (URLLC)**, where stability matters far more than peak capacity [12]. A high average SNR is useless if the link is prone to unpredictable fades.
Thus, **ITU-R tests the system**: it provides the stable baseline needed to verify “five-nines” reliability (99.999%), ensuring that a successful simulation implies robustness in real-world deployment.
5.4 The Outlier: The 28 GHz Trap
Our analysis of the **Indoor 28 GHz** scenario highlights a unique case where the ITU-R deviates in the opposite direction. Here, the ITU-R “Optional Model I” exhibits extreme optimism (34 dB gap) compared to the 3GPP stochastic baseline. This reflects a trade-off between computational simplicity and physical realism. Researchers must be aware that this specific ITU-R model is an idealized simplification. Using it to validate indoor URLLC would be dangerous, as it hides the blockage dynamics that are the main adversary at 28 GHz.
5.5 Strategic Model Selection
The choice of channel model acts as a silent “gain” or “loss” knob in system simulations. In short, channel-model selection is not a detail – it is a strategic modeling decision.
1. Use 3GPP TR 38.901 for eMBB capacity evaluation, where the system is expected to exploit signal peaks.
2. Use ITU-R M.2412 (Standard) for URLLC reliability benchmarking, where the model’s conservative nature provides a necessary stress test.
3. Avoid ITU-R Optional Models for realistic deployment planning at mmWave frequencies.
6 Conclusion
This paper presented a comprehensive comparative study of the 3GPP TR 38.901 and ITU-R M.2412 channel models, implemented within a unified ns-3 framework. By analyzing four canonical deployment scenarios, we quantified the practical impact of technical divergences in pathloss formulas and fading parameters.
Our results demonstrate that while the models converge in simple rural and standard indoor settings, they diverge sharply in complex urban environments. In UMa NLOS, the ITU-R model proves to be significantly more pessimistic (9.5 dB median SNR deficit). In UMi NLOS, a critical trade-off was identified: 3GPP predicts higher capacity but higher volatility, while ITU-R describes a more stable, lower-capacity channel. Furthermore, we exposed a massive 34 dB discrepancy in indoor mmWave modeling, identifying the ITU-R Optional Model as an idealized outlier.
We conclude that these divergences represent distinct simulation philosophies. The 3GPP model is an optimistic predictor suitable for eMBB capacity planning, whereas the standard ITU-R model serves as a conservative benchmark ideal for stress-testing URLLC reliability. Together, they form the two necessary ends of the 5G design spectrum.
Suggestions for Future Research
Looking forward, there are several meaningful ways to expand this research to refine how we evaluate next-generation networks:
• MIMO Beamforming: Incorporating massive MIMO and spatial selectivity might either magnify or mitigate the divergences seen in our SISO analysis.
• Hybrid & AI Models: A promising direction is to explore hybrid models or AI/ML-based site-specific models Alkhateeb2021 to bridge the gap between stochastic estimation and physical reality.
• Extension to sub-THz: Validating these models against measurements in the 100-300 GHz range will be essential as the industry moves towards 6G networks 6GFlagship2020.
References
[1] International Telecommunication Union, “IMT Vision – Framework and overall objectives of the future development of IMT for 2020 and beyond,” ITU-R, Recommendation M.2083-0, 2015. [Online]. Available: https://www.itu.int/rec/R-REC-M.2083-0-201509-I/en.
[2] C.-X. Wang, J. Bian, J. Sun, W. Zhang, and M. Zhang, “A survey of 5g channel measurements and models,” IEEE Communications Surveys and Tutorials, vol. 20, no. 4, pp. 3142–3168, 2018. DOI: 10.1109/COMST.2018.2862141.
[3] T. S. Rappaport, Wireless Communications: Principles and Practice, 2nd. Upper Saddle River, NJ, USA: Prentice Hall, 2002.
[4] 3GPP, “Study on channel model for frequencies from 0.5 to 100 GHz,” 3rd Generation Partnership Project (3GPP), Technical Report TR 38.901, version V17.0.0, 2023. [Online]. Available: https://www.3gpp.org/ftp/Specs/archive/38_series/38.901/.
[5] International Telecommunication Union, “Guidelines for Evaluation of Radio Interface Technologies for IMT-2020,” ITU-R, Report M.2412-0, 2017. [Online]. Available: https://www.itu.int/rec/R-REP-M.2412/en.
[6] D. Tse and P. Viswanath, Fundamentals of Wireless Communication. Cambridge, UK: Cambridge University Press, 2005.
[7] S. Kotz, T. J. Kozubowski, and K. Podgórski, The Laplace Distribution and Generalizations. Springer, 2001.
[8] C. Politis, M. A. Usman, and N. Weerasinghe, “OUTLOOK: Visions and research directions for the Wireless World – WWRF-IEG’s Evaluation of IMT-2020 Candidate Technology Enhanced Ultra High Throughput 5G (EUHT-5G) revised submission from NUFRONT,” Wireless World Research Forum (WWRF), White Paper, version 3.1, 2023. [Online]. Available: https://wwrf.ch/wp-content/uploads/2023/04/Outlook31-EUHT-5G_V3.2_AU.pdf.
[9] J.-M. Kelif et al., “Statistical characterization of shadow fading in urban environments,” IEEE Transactions on Vehicular Technology, vol. 59, no. 3, pp. 1025–1034, 2010. DOI: 10.1109/TVT.2010.2041234.
[10] E. Dahlman, S. Parkvall, and J. Skold, 5G NR: The Next Generation Wireless Access. Academic Press, 2018, Discusses HARQ and dynamic adaptation mechanisms in 5G.
[11] X. Ge et al., “Ultra-reliable low-latency communications in autonomous vehicular networks,” arXiv preprint arXiv:1903.01863, 2019. [Online]. Available: https://arxiv.org/abs/1903.01863.
[12] P. Popovski et al., “Wireless access for ultra-reliable low-latency communication: Principles and building blocks,” IEEE Network, 2019, Defines reliability and stability as primary KPIs over capacity.
Footnotes
1The complete source code developed for this study is available at: https://github.com/simultelco/ns-3-itu
Biographies

Nicolò Avarino received his B.Sc. in Computer Engineering from Politecnico di Milano and his M.Sc. in Networking and Data Communications from Kingston University London, where his thesis focused on the comparison of wireless communication channel models. He is currently working as a Cybersecurity Engineer, with interests in secure network architectures, wireless communication systems, and emerging technologies in digital infrastructure.

Nuwan Weerasinghe is an experienced researcher and technologist with over two decades of work in artificial intelligence, machine learning, data analytics, telecommunications, and digital health. He received his B.Sc. in Electrical and Information Engineering from the University of Ruhuna, Sri Lanka, and a Ph.D. from Kingston University London, where his doctoral research focused on enhancing security and reliability in future multi-hop wireless networks. He is currently a Consultant at the World Health Organization (WHO) Regional Office for Europe, leading AI-driven initiatives in digital health innovation, cloud infrastructure, and public health data monitoring, and has co-authored WHO publications on food environments and digital marketing practices. He is also the Founder and CEO of Simultelco Ltd., developing cloud-based network simulation technologies for 5G/6G research. Since 2020, he actively contributes to the WWRF Independent Evaluation Group on IMT-2020 (5G) technologies, with focus on cloud-native simulation and AI-integrated telecom architectures. His academic interests include digital health, future communication networks, V2X systems, and responsible AI in public sector innovation. He also serves as a Visiting Lecturer at Kingston University London and has published extensively in journals, conferences, and policy-focused publications.

Christos Politis Professor (Chair) of Digital Technologies at Kingston University London (KU), School of Computer Science (CS), where I am currently a senior member of the Cyber, Engineering and Digital Technologies KERI. Upon joining KU, I founded and led a research group on Wireless Multimedia and Networking (WMN). I teach modules on wireless systems, networks and protocols. Prior to this post, I worked for Ofcom, the UK Regulator and Competition Authority, as an R and D Team Leader. While at the University of Surrey, UK, I was a PostDoc Researcher (PDRA) working on virtual distributed testbeds in the Centre for Communication Systems Research (now the Institute for Communication Systems, 6G Innovation Centre). This was preceded by engineering positions with Intracom-Telecom SA and Maroussi 2004 SA in Athens, Greece. I have managed to raise sustained funding from the EU and UK research and technology frameworks under the ICT and Security programmes (FP5/6/7, H2020, Horizon Europe, EPSRC and Innovate UK). I hold two patents and have published over 230 papers in international journals and conferences and chapters in ten books. In parallel to my academic career, I am heavily involved in building and managing technology start-ups. At the same time to the above, I am the Founder and one of the Directors of Ubitech Ltd. Ubitech has recently launched its first product called UbiTheraPlay, which is a gaming platform for the rehabilitation of neurodivergent people. I also advise and consult for several governments, Universities and commercial organisations on their research programmes/agendas, policies and portfolios in EU, UK, Canada, Greece, Qatar, China, Malaysia to mention a few. I hold a PhD and MSc from the University of Surrey, UK and a BEng from the University of Athens, Greece, all in Electrical/Electronic Engineering. I am senior member of the IEEE and UK/Greece chartered engineer.